From a table nobody reads to one image
You supply your figures or your process steps with the source attached. We determine which chart type suits that data and draw it in your colours. From €129.
From €129 excl. VAT · price shown before you order
- Infographic from €129, including the research on the form
- Delivery as SVG, PNG and PDF
- Digital version at 1200 x 1500 pixels in sRGB, at double screen resolution
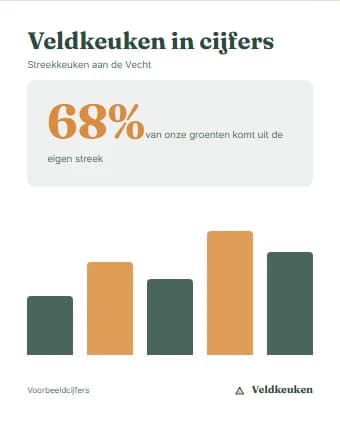
Fictional design example
- First the question, then the form
If you compare five parties with each other, bars work. If you show a trend over ten years, it becomes a line. That research is included in the price of €129 and determines whether your infographic works.
- The source is underneath
Under the chart it states where the figures come from and which period they cover. Without that line, someone who shares your image cannot check whether it is right, and that costs you credibility exactly at the moment you need it.
- SVG included, so you can enlarge
Alongside a PNG for your website you get an SVG. That is a file built with mathematics instead of pixels, so you enlarge it to trade show size and the lines stay sharp.
This is what it looks like when it is done.
Below is our design studio, opened on the infographic: fill in your own business name and tagline, switch the colour palette and the typeface, and the big number and the bars change along. Switch on the print-ready button to see the safe zone we keep for digital work.
First the question, then the form
If you compare five parties with each other, bars work. If you show a trend over ten years, it becomes a line. That research is included in the price of €129 and determines whether your infographic works.
The source is underneath
Under the chart it states where the figures come from and which period they cover. Without that line, someone who shares your image cannot check whether it is right, and that costs you credibility exactly at the moment you need it.
SVG included, so you can enlarge
Alongside a PNG for your website you get an SVG. That is a file built with mathematics instead of pixels, so you enlarge it to trade show size and the lines stay sharp.
Colours with enough difference between them
We keep to your house style and make sure the colours in the chart are far enough apart. Even printed in black and white it stays visible which bar belongs to which series.
Also suitable for print
For €29 extra we make a print-ready version: colours in CMYK, image at 300 dpi, 3 mm bleed all round and crop marks included. That can go on an A3 or a trade show panel without adjustment.
Working example with fictional content. The components you choose determine the final result.
Examples of infographic
Browse possible designs and applications. Open an image to take a closer look.
Een verhaal met cijfers en stappen
Een infographic op groot formaat

What can this service do for you?
An infographic costs more than a banner, and that is because of the thinking beforehand. Before anything is drawn, it has to be clear what your reader should remember. Seven percentages in a pie chart stick with nobody. One number large on screen, with the rest underneath, does.
We look at what your data shows, choose the form that suits it and put the source underneath, so someone who forwards your chart can check where it comes from. You get it as SVG and as PNG. With that SVG you blow it up to a two-metre trade show panel without the edges going grainy. From €129.
Everything taken care of.
- Infographic from €129, including the research on the form
- Delivery as SVG, PNG and PDF
- Digital version at 1200 x 1500 pixels in sRGB, at double screen resolution
- Source reference and measurement period under the chart
- Colours from your house style, with sufficient mutual contrast
- Chart type chosen based on what your figures show
- Separate variant on A3 for print or for a trade show panel
- Process diagrams with numbered steps, also possible without figures
- Revision round on copy, figures and layout included
- Print-ready PDF for €29 extra, editable source files for €49
Your project and our team. Always close by.
After you order, your project appears in your own dashboard. Follow the progress, share files, give feedback and arrange your next step there.
- Project and progress
- Feedback in one place
- Contact with your team
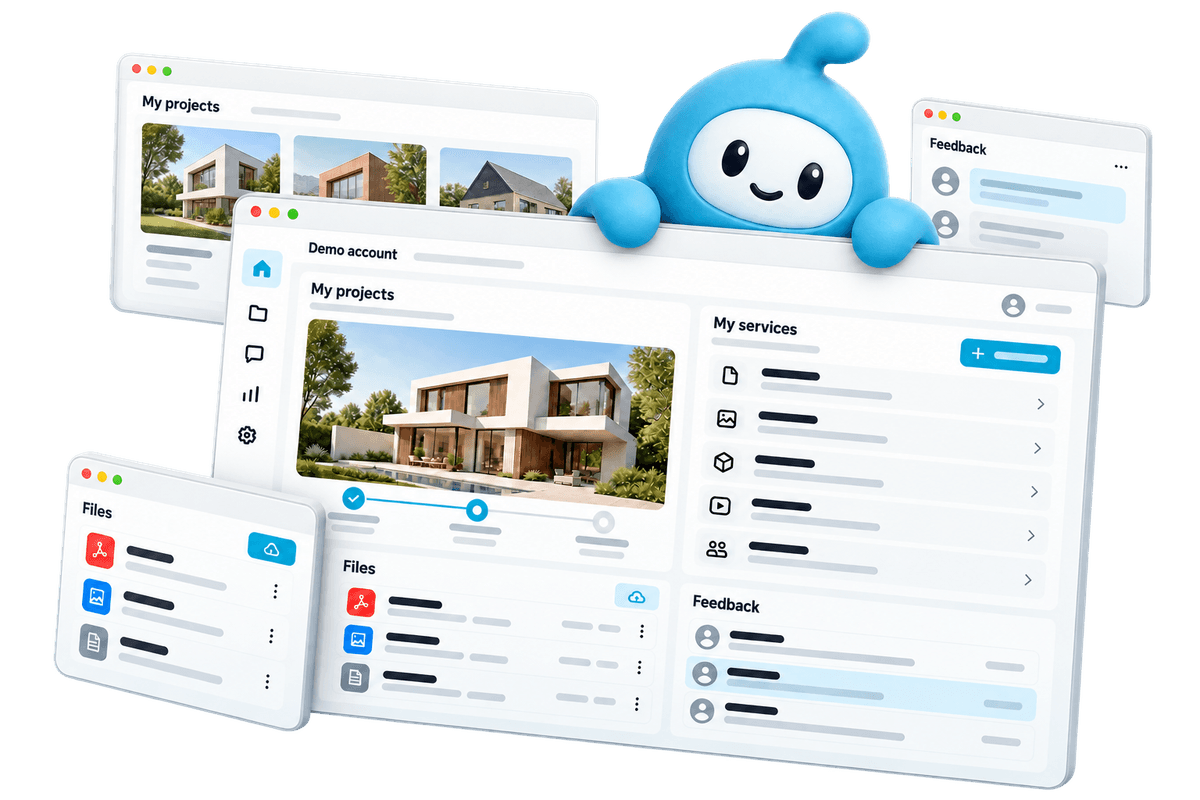
Demo account. Workspaces depend on the services you choose.
From your first choice to your next step.
Choose what you need
View the examples and configure your service. You see what you get and what it costs before you order.
Create together
Share your wishes and material in your dashboard. Follow the work and give feedback there.
Online and beyond
After delivery, request a change or an extra service when your business is ready.
Frequently asked questions
What does an infographic cost?
€129 for one infographic, including the research beforehand on which form suits your data. If it also has to be printed, €29 is added for the print-ready delivery. Editable source files cost €49. In the configurator you tick what you need and the amount updates.
How many revision rounds are included?
One round on copy, figures and layout. With an infographic that round is usually about a number that is rounded slightly wrong or a label that is too long. If you find out afterwards that the whole setup has to be different, that is new work. That is why we set the setup down in writing in advance and you get to read it first.
In which file formats do I get it?
SVG, PNG and PDF. The PNG is at 1200 x 1500 pixels in sRGB and at double screen resolution, so it stays sharp on a screen with high pixel density. The SVG you use when you want to enlarge it, for example to a trade show panel or a wall print.
Can I update the figures myself later?
With the standard delivery that is tricky, because the chart is drawn out. If you expect new figures every quarter, take the editable source files of €49 or say so before we start. Then we build it so a number and the matching bar can be adjusted separately.
Do I have to supply the figures myself?
Yes, and also where they come from. Send your table, the research or the export from your own system, with the period attached. We do not calculate anything for you and do not make up numbers. If a sum does not add up, you hear about it before we start drawing.
Can you also explain a process without figures?
Yes. A sign-up route, a production process or a customer journey often works better as a numbered diagram than as a list of bullets. You supply the steps in the right order, with per step who does what, and we turn it into one continuous image.
Do you deliver print-ready?
For €29 extra. On a screen sRGB works, on paper it becomes CMYK, because a printing press makes colour with ink and your screen with light. Bright screen colours come out calmer on paper. We set the image at 300 dpi, give it 3 mm bleed all round with crop marks, and keep text at least 5 mm from the trim edge.
What you can check up front
- You see the price before you order and put together exactly what you need
- 14-day cooling-off period on your online order
- Pay in one go or in 3 instalments at 0%
- The platform subscription can be cancelled monthly
Ready to get started?
Configure your infographic, see the price before you order and follow the work in your dashboard.
Infographic from €129 excl. VAT